Performance monitoring and profiling are two different
aspects. The former takes a more of a proactive measure whereas the latter is a
reactive approach. In my experience, performance is an afterthought in most
cases rather than being built into the software development life cycle. I see
the same thing in most cases when it comes to security as well but let us not
go there today as that lends itself to a different post.
Performance monitoring
In order to monitor your application, you first need to
understand what performance aspects the end users of your application expects.
This would include throughput, response time, uptime etc. After you collate
these information, the next step would be to create scripts for load testing
your application. Coming primarily from a Java background, I normally use
JMeter which comes with a user friends UI to create load testing depending on
your use case be it database, Web Service, JMS etc.
So you have your load testing scripts and it is running
fine. What next?
Well now that you have the load scripts in place, the next
step would be note down what parameters you should monitor. Generally you would
start out monitoring the CPU and Memory usage while your load test is in
progress.
When you monitor CPU, you would be looking at the CPU usage
as the application is being load tested. If there is high CPU usage, you need
to further drill down to find out what issue might cause this. If there is low
CPU usage, then probably you can try and increase the load to see what the
optimum load that uses efficient CPU.
If you are on a Windows machine, by default you will open
the task manager and go into the Performance tab in order to find out what your
CPU is up to. A snippet of mine is as follows;
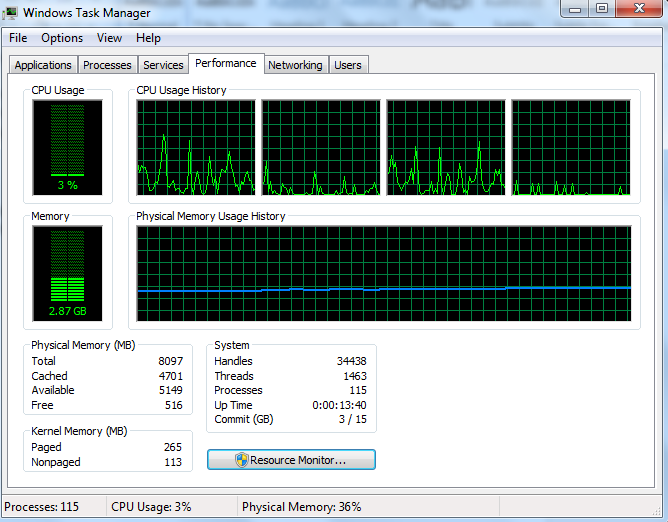
I’m running on a Core i5 with 8GB of RAM. In the upper right
hand corner you can see the CPU usage history. The four boxes here represent
the four CPUs. You will get the same value if you run Runtime.getRuntime().availableProcessors() within a Java program.
By default it only shows the total CPU time. But you can easily add the kernel CPU
time by clicking onn View-> Show Kernal Times. You will then be presented
with the following graphs with a red line;

The space between the red line and the green line is the
user CPU time. So what is the difference between the user and the kernel CPU
time you might ask.
User CPU Time :
The amount of time the CPU spends on running your application code.
Kernel CPU Time :
The amount of time the CPU spends on operating system related activities. For example
if your application does a lot of reads/writes to the disk, you will see high
kernel CPU as it requires the operating system related functionality to be
invoked.
But what if you needed further information on what your CPU
is doing at any given moment of time? PerfMon
to the rescue. Open up a Run tab and type in perfmon and you will be presented with the following screen;

You can add any counter which you are interested in
monitoring by right clicking on the graph area and selecting the Add Counters menu option. If you want
to monitor the user CPU and kernel CPU, select the Performance object and under that you will find the User time and Privileged
time (kernel CPU time) counters.
Another key indicator to watch out for when monitoring CPU
is the CPU schedule run queue. This is where all light weight processes needed
to run are queued up waiting for CPU. As a rule of thumb, if your run queue
depth is more than four times the available virtual processors on your machine,
then you need to investigate your application further more to see what could be
done. In the era of high memory machines, people often overlook the fact of
using and writing efficient algorithms and data structures as there is plenty
of memory available on high end servers. But the issue here is that many a
times CPU is limited. If your algorithms/data structures do not scale well with
added load, you will end up over loading your CPU with the only alternative
being is to scale your application into different servers. So if you are having
issues with the scheduler run queue depth, it is always best to see the
possibility of writing certain sections of your application code in a more
efficient manner so as to utilize your CPU better. The run queue depth can also
be monitored using Perfmon by
selecting Add Counters->System->
Processor Queue Length.
Now that we have covered some of the important factors to
look into in terms of CPU when monitoring your application, in the next post we
will look at what aspects we need to consider when monitoring the memory usage.
Please do leave by your comments and suggestions which is as
always much appreciated as I love learning from the experience of others which I
deem as invaluable.